
Announcing AGC's grain chain infographic

In May 2021 we celebrated a birthday—our grain value chain illustration has finally come to life and is ready for use as an educational tool.
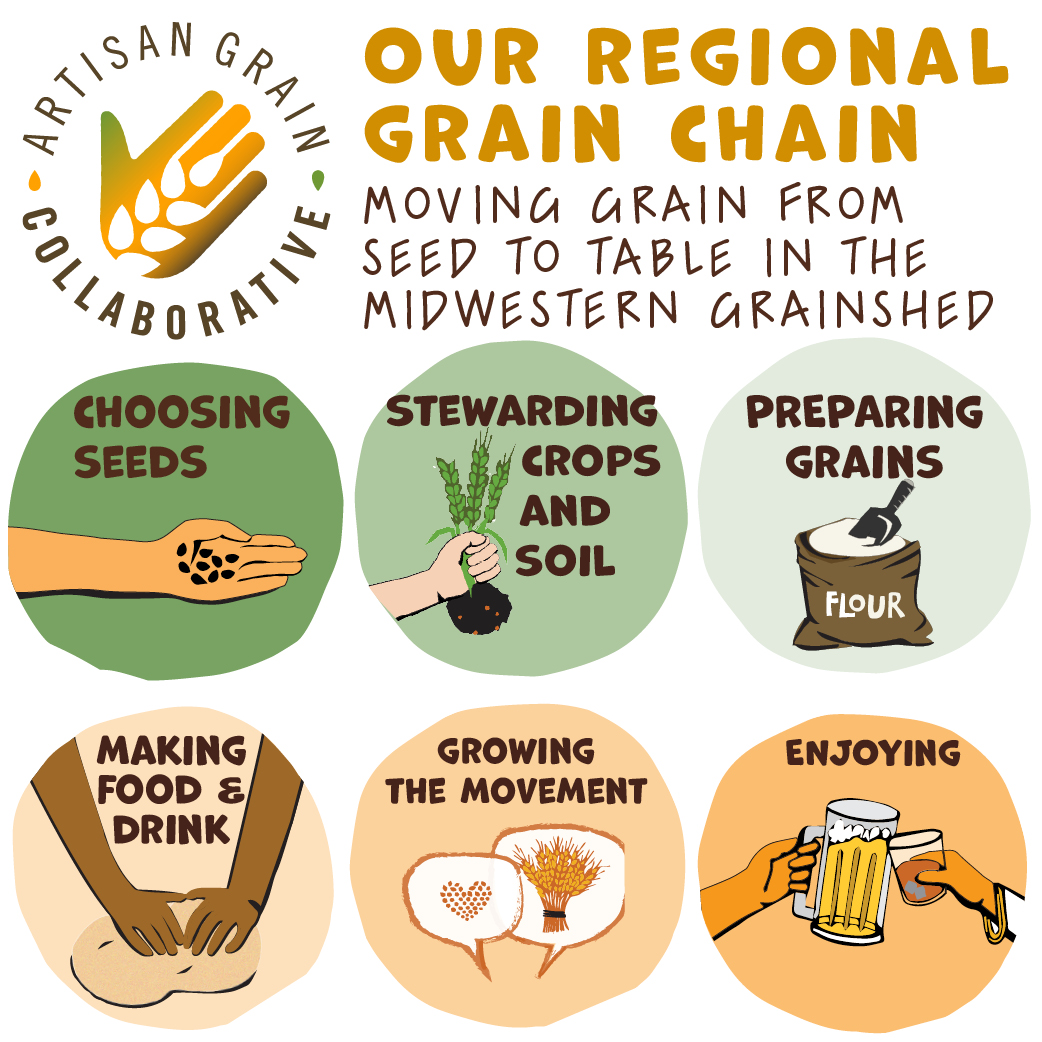
We saw the need for a visual aid to illustrate the many intersecting relationships required to sustain our regional grain chain in the Midwest. This is a complex system that is often invisible, and graphic recorder Amy Sparks, A Visual Spark, of Minneapolis, MN, has made the subject approachable and fun.
The graphic depicts the entire grain chain from farmer, to researcher, to eater and drinker, as well as the many jobs and connections required along the way for a grainshed to exist and thrive. AGC’s communications team worked with our Coordinating Committee, Education & Outreach Working Group, and many contributing members to ensure that this snapshot was as complete and representative of our regional grain chain as possible. The drawing and accompanying text highlight some of the connections that make this burgeoning system possible. The collaboration vignettes in the bottom half of the main graphic, shown below as a snippet, are sample interactions that occur among value chain actors.

We see this graphic as a starting point for conversations about the many variables and factors involved in the production, marketing, and education around regional grains.
Perspectives from AGC’s 140+ members at the time of development informed this illustration, and those members will be bringing this graphic to life through various future storytelling opportunities. We’re eager to see the illustration displayed in cafes, tasting rooms, and farmers’ market stands. We also look forward to seeing AGC members and others use the accompanying social media tiles to shine a light on their everyday work as they communicate with fans and customers.

“What we’re involved with here as a group and as a society is some of the most important work right now—our response to climate change and how we, in our agricultural systems, look to move towards a system that is responsive to those challenges. I think this graphic shrinks down and illustrates both the complexity but also the places where people can imagine themselves within this grain chain, and how they themselves—whether a farmer, a processor, a grocery buyer, or a consumer—can improve on each one of those systems. It gives us all a new tool to accelerate that process forward. There’s such a need right now for infrastructure, and I think this will help anyone who has agency to help build these networks.”

“I think it’s so cool to visually see the chains of how things get from farm to table. I like seeing that everyone is represented—everyone can point to a part on this chain and say, ‘that’s where I fit in.’ I see us printing this on the postcard we include with every order we ship, and taking it to farmers markets and festivals to be able to start a conversation about what grain is, what the grain chain is, why grains are important, and why they’re healthy for you. We also want to print the chain onto packing tape to use on the boxes we ship, to get people asking questions and wondering where their food is coming from, and how many different people were part of getting them their food.”

“Being on the end-user side, a baker, I’m physically removed from the fields, so communicating to our customers about the immense efforts that go into processing grain, growing grain, doing grain research and all of that is so important. It’s easier to not think about that when you’re on the consumer side, just getting a loaf of bread. So this is a great way to communicate how and why grain is different from a farm to table tomato or strawberry, for example, and for customers to see every link in the chain. I think it's very helpful in educating the public about the difference between regional grain and commodity grain, and the benefits of that in a really easy to read, fun, and super packed little card.”

In making this tool, AGC leaned on illustrations that came before, including one from Mona Esposito—The Grain Lady—depicting the grain chain components of “growing a local grain movement” in Colorado. A graphic from Deer Creek Malthouse in Pennsylvania that diagrams “the journey of wheat from field to plate” also served as inspiration. Another graphic we reviewed and appreciated was drawn by Nikki Burch and published by Grist in 2015 to describe “why good bread costs more dough”—the difference between commodity and artisanal systems, from farming to distribution of bread.
We hope this infographic acts as a spark for deeper contemplation and conversation about where staple foods come from and how they get from field to you.
Please share widely!
Below, please find special adaptations of the infographic suited to sharing on social media.
If you have questions about the graphic, reach out to AGC’s Communications Manager, Elena Byrne: ebyrne@graincollaborative.com.


