
Summary report on AGC's collaboration with the Whole Grains Council Consumer Insight Survey
Contributed by Rebekah Schulz
AGC had a great opportunity to participate in the development of the 2025 Whole Grains Council (WGC) Consumer Insight survey, expanding on our previous work with AGC’s Grain Views and Habits Survey.

Conducted every few years, the WGC survey is census-representative, with responses from 1,500 American adults across a range of demographics.
As a subset of the larger WGC survey, AGC contributed eight survey questions geared towards understanding consumer perceptions, attitudes, barriers, and motivators specifically about local grains. AGC member Bekah Schulz is leading this project as part of her PhD work at the University of Minnesota Department of Food Science and Nutrition, and has an advisory team that includes four AGC members: Patrick Wylie of Baker’s Field Flour & Bread (MN), Jenny Haglund of Bird Dog Baking (MI), Wes Gardner of Meadowlark Community Mill (WI), and Noreen Thomas of Doubting Thomas Farms (MN). We’re digging into these results with the intention of improving the way we communicate and engage with consumers about their local grain chain, getting them excited about the flavor and benefits of local grain, and supporting everyone from farmers to eaters.
The comprehensive WGC report comes out in October with more in-depth detail on local grain insights. In the meantime, this summary gives a taste of the key findings from AGC’s local grain questions. Read on to discover what we found, and keep an eye out in October for the finalized report.
The online survey was conducted from May 29-June 6, 2025 and consisted of 1,500 census-representative respondents, the majority of which were the primary grocery buyers in their household and with ages ranging from 18-91. Of the 76 total questions, AGC contributed 8 questions focused on consumer perceptions and attitudes towards local grains. The scope and wording of the questions, which are shown here below the data charts, were developed collaboratively by the AGC members serving on the advisory team. The survey data was analyzed descriptively using SAS and R v.4.5.1 software.


Of all purchasing locations where respondents shopped for grain products, 40% or more of the respondents said local grains were “extensively available” at the farmer’s market, and coop/natural foods stores (Figure 2). Viewing the data from figures 1 and 2 together, respondents are not buying grain products frequently where local grains are extensively available (coop and farmer’s market) and respondents are frequently buying grains (grocery store / supermarket / supercenter) where local grains are less available).

When asked how often they choose a local grain version of various grain foods when a local grain version is available, respondents indicated that they do not favor a certain type of local grain product over another (Figure 3). As a result, it appears that many types of local grain products are of interest to consumers.

Regarding the origin of their grain and whether it is local (Figure 4), 41% of respondents said that they care that the grain is local (agree or strongly agree), 41% are neutral (neither agree nor disagree) and 17% don’t care (disagree or strongly disagree). Combining the data from figures 3 and 4, the percent of respondents who choose local grains when available is consistent with the percent of respondents who care where the grain in their grain product is grown and that it is local.

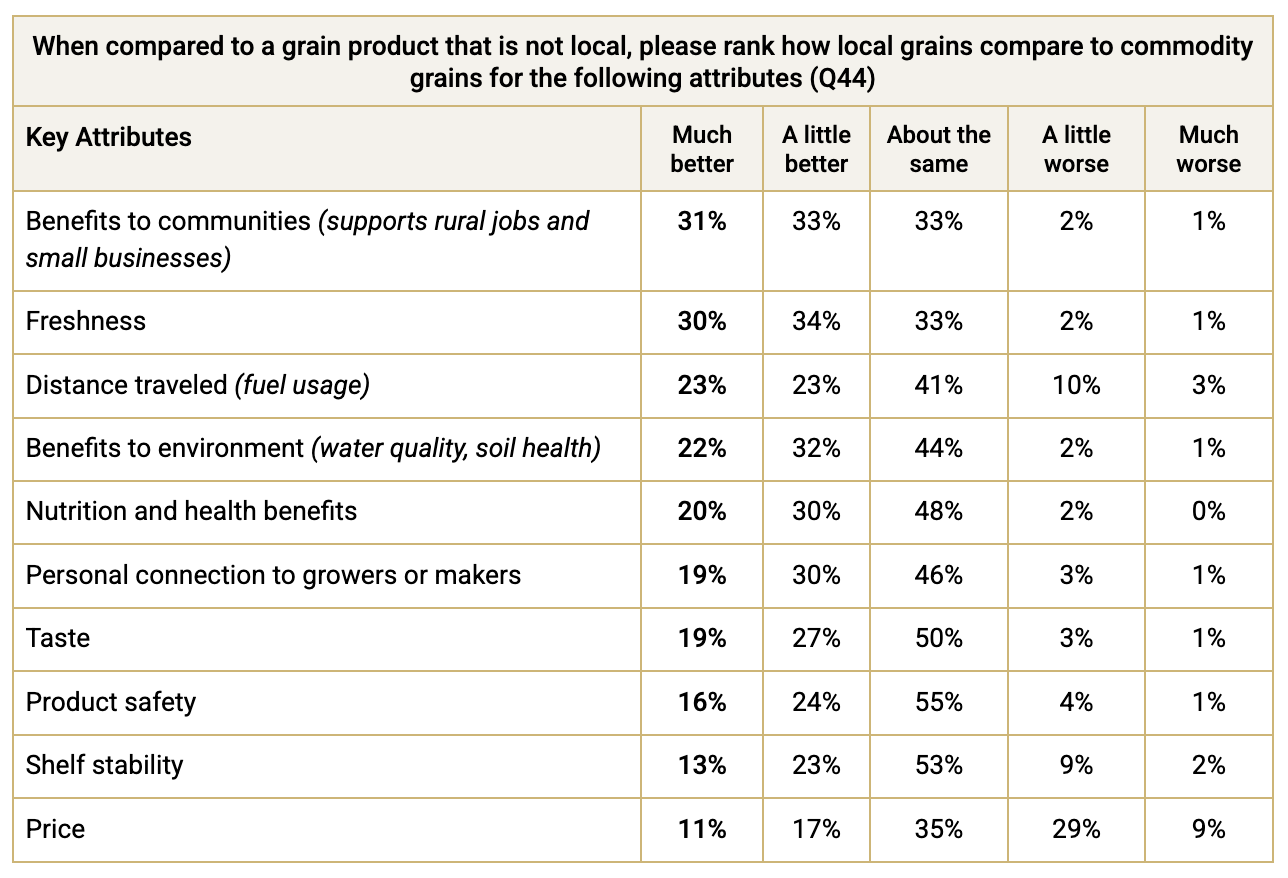
When asked how local grains compare to commodity grains on various attributes, while most respondents ranked local grains as “the same” or better than commodity grains, indicating that there are not negative perception issues, these answers also highlight that educational opportunities exist for many attributes (Table 1).
Overall, barriers to purchasing foods made with local grains are not very high, with the top barriers being selected by only one-third of respondents. Cost (35%), lack of local grain options (31%), and hard-to-identify local grains (29%) are the top three barriers to consumers purchasing local grain products (Figure 5).

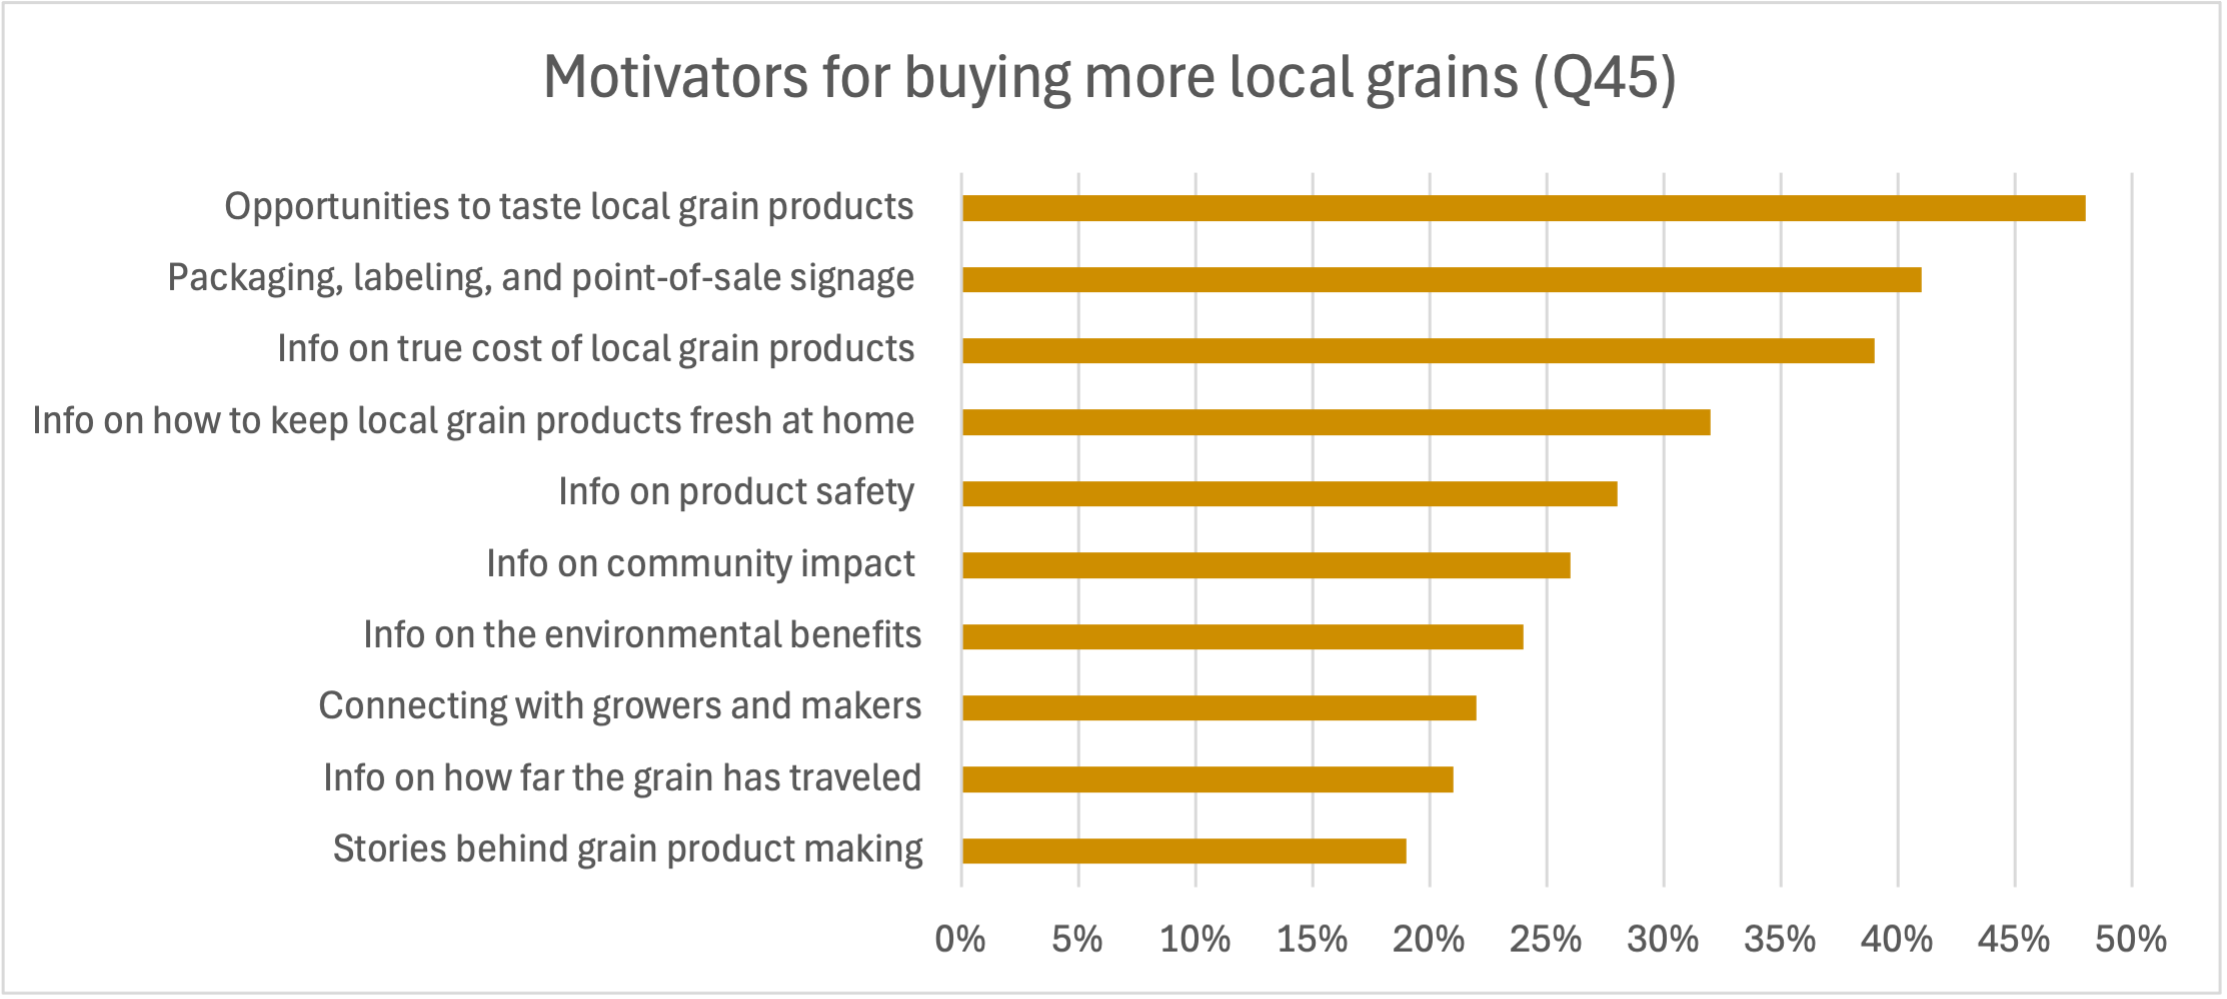
The top three motivators, on the other hand, are tasting opportunities (48%), more packaging, labeling, and point-of-sale signage (41%), and information on true cost (39%) (Figure 6) (Q45). Combining data from figures 5 and 6, this combination of low barriers and easily implementable motivators along with offering local grains where most people are buying grains (supermarkets), pose viable and strategic intervention options for local grain businesses.
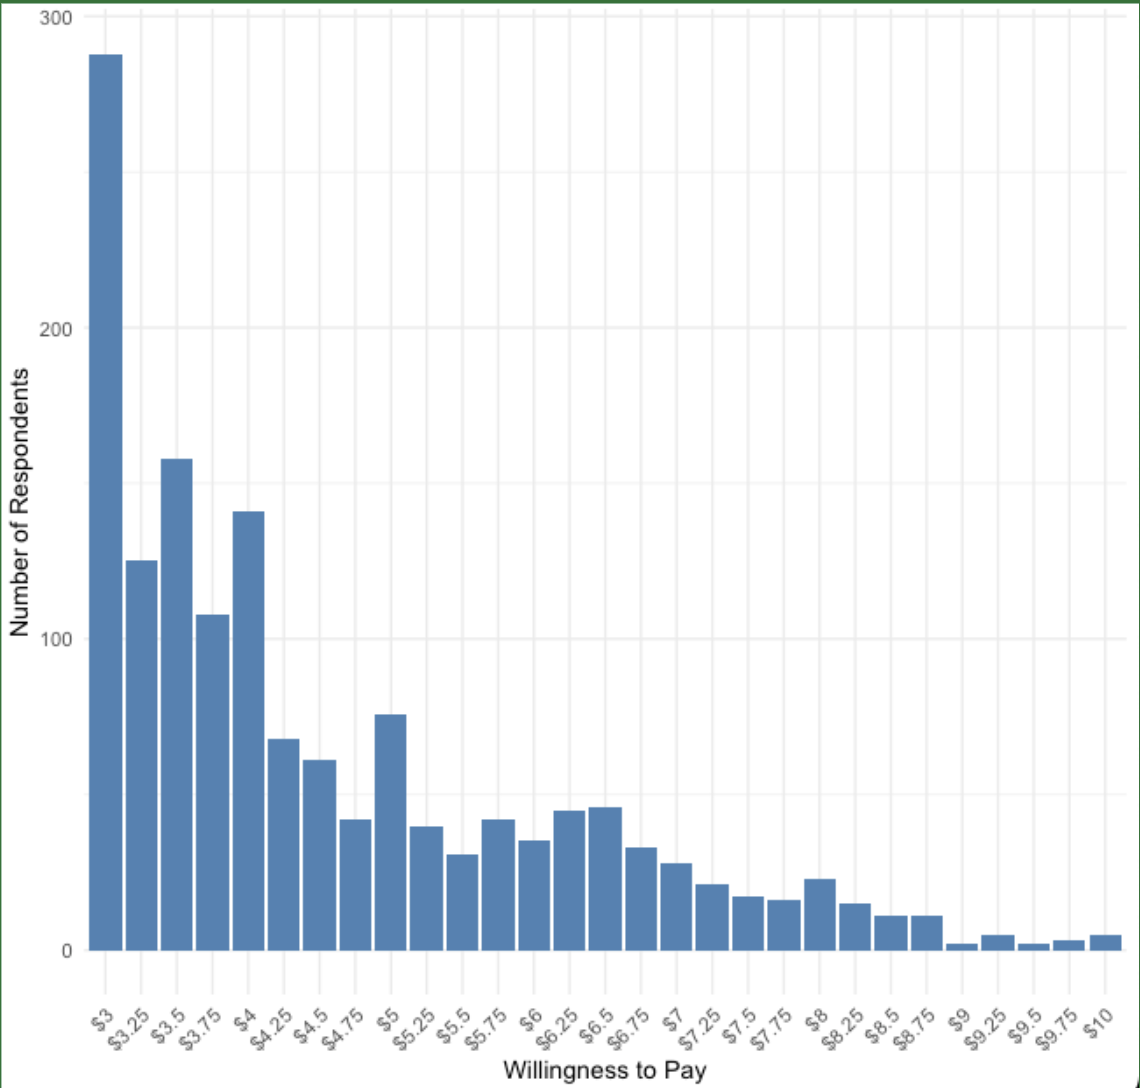
When asked how much they would pay for a local grain pancake mix in comparison to a mix from a larger company (identical in taste, preparation, and package size) and when the pancake mix from the larger company costs $2.99 for a 32 oz. box (serving size: 18), respondents on average, were willing to pay a premium of $1.59 (Figure 7) (Q46). 19% of respondents are not willing to pay a premium for a local grain pancake mix (any amount greater than $3), while 33% of respondents are willing to pay a premium of $0.25-$1 more, 16% of respondents are willing to pay a premium of $1.25-$2, and 10% of respondents are willing to pay a premium of $2.25-$3, when the starting price is set at $3.
When asked whether their answer would change if the local pancake mix was also whole-grain, 13% of respondents are not willing to pay a premium, 31% are willing to pay a premium of $0.25-$1, 18% are willing to pay a premium of $1.25-2, and 12% are willing to pay a premium of $2.25-3 when the starting price is set at $3.
AGC is committed to deepening consumer connections and engagement with local grains, and we're looking forward to further honing the ways that we educate and communicate with eaters in ways that are meaningful to them. If you have questions or would like to discuss this project, please contact AGC's Communications Manager, Elena Byrne: ebyrne@graincollaborative.com
Q38 - How frequently do you buy grain products from each of the following outlets?
Q39 - Are products made with local grains available at the places where you shop for grain products? (Think tortillas, pancake mix, bread, cereal, etc.)
Q40 - When they are available, how often do you choose local grain versions of these foods? For the foods that you eat, please indicate what percent of the time you choose foods made with local grains when they are available. (i.e. You eat pasta and 50% of the time you choose pasta that is made with local grains.)
Q41 - Indicate your level of agreement with this statement: “I care where the grain in my grain products was grown and that it is local.”
Q42 - What are the barriers you face in purchasing foods made with local grains?
Q44- When compared to a grain product that is not local, please rank how local grain products compare on each of the following attributes.
Q45 - What would motivate you to buy more local grain products?
Q46 - Consider the following scenario: Two grain pancake mixes are available; one from a small business that uses local grain, and another from a larger company. These two products are otherwise identical, including taste, preparation, and package size. The pancake mix from the larger company costs $2.99 for a 32 oz. box (serving size: 18). How much are you willing to pay for the pancake mix from a small business using local grains?